Website and API monitoring
Pingstack requests your URL from up to three probe regions (US East, EU West, AP South) and checks the status code you expect. Checks run as often as every 30 seconds on Business, every minute on Pro and Team, and every five minutes on Free. If one of our probe regions is unhealthy, we hold back alerts from it.
How it works
- Add the URL and the status code you expect.
- Pick the interval and regions your plan allows.
- Set the thresholds. Choose how many regions must fail before the check is degraded or failing, then route it to a notification group.
What you can configure
| Setting | What it does |
|---|---|
| Expected status code | The response that counts as up |
| Interval | Every 5 minutes on Free, every minute on Pro and Team, every 30 seconds on Business |
| Regions | 1 on Free, all regions on paid plans |
| Degraded and failing thresholds | How many regions must fail before each state |
| Notification groups | Who gets alerted, and how |
What you see
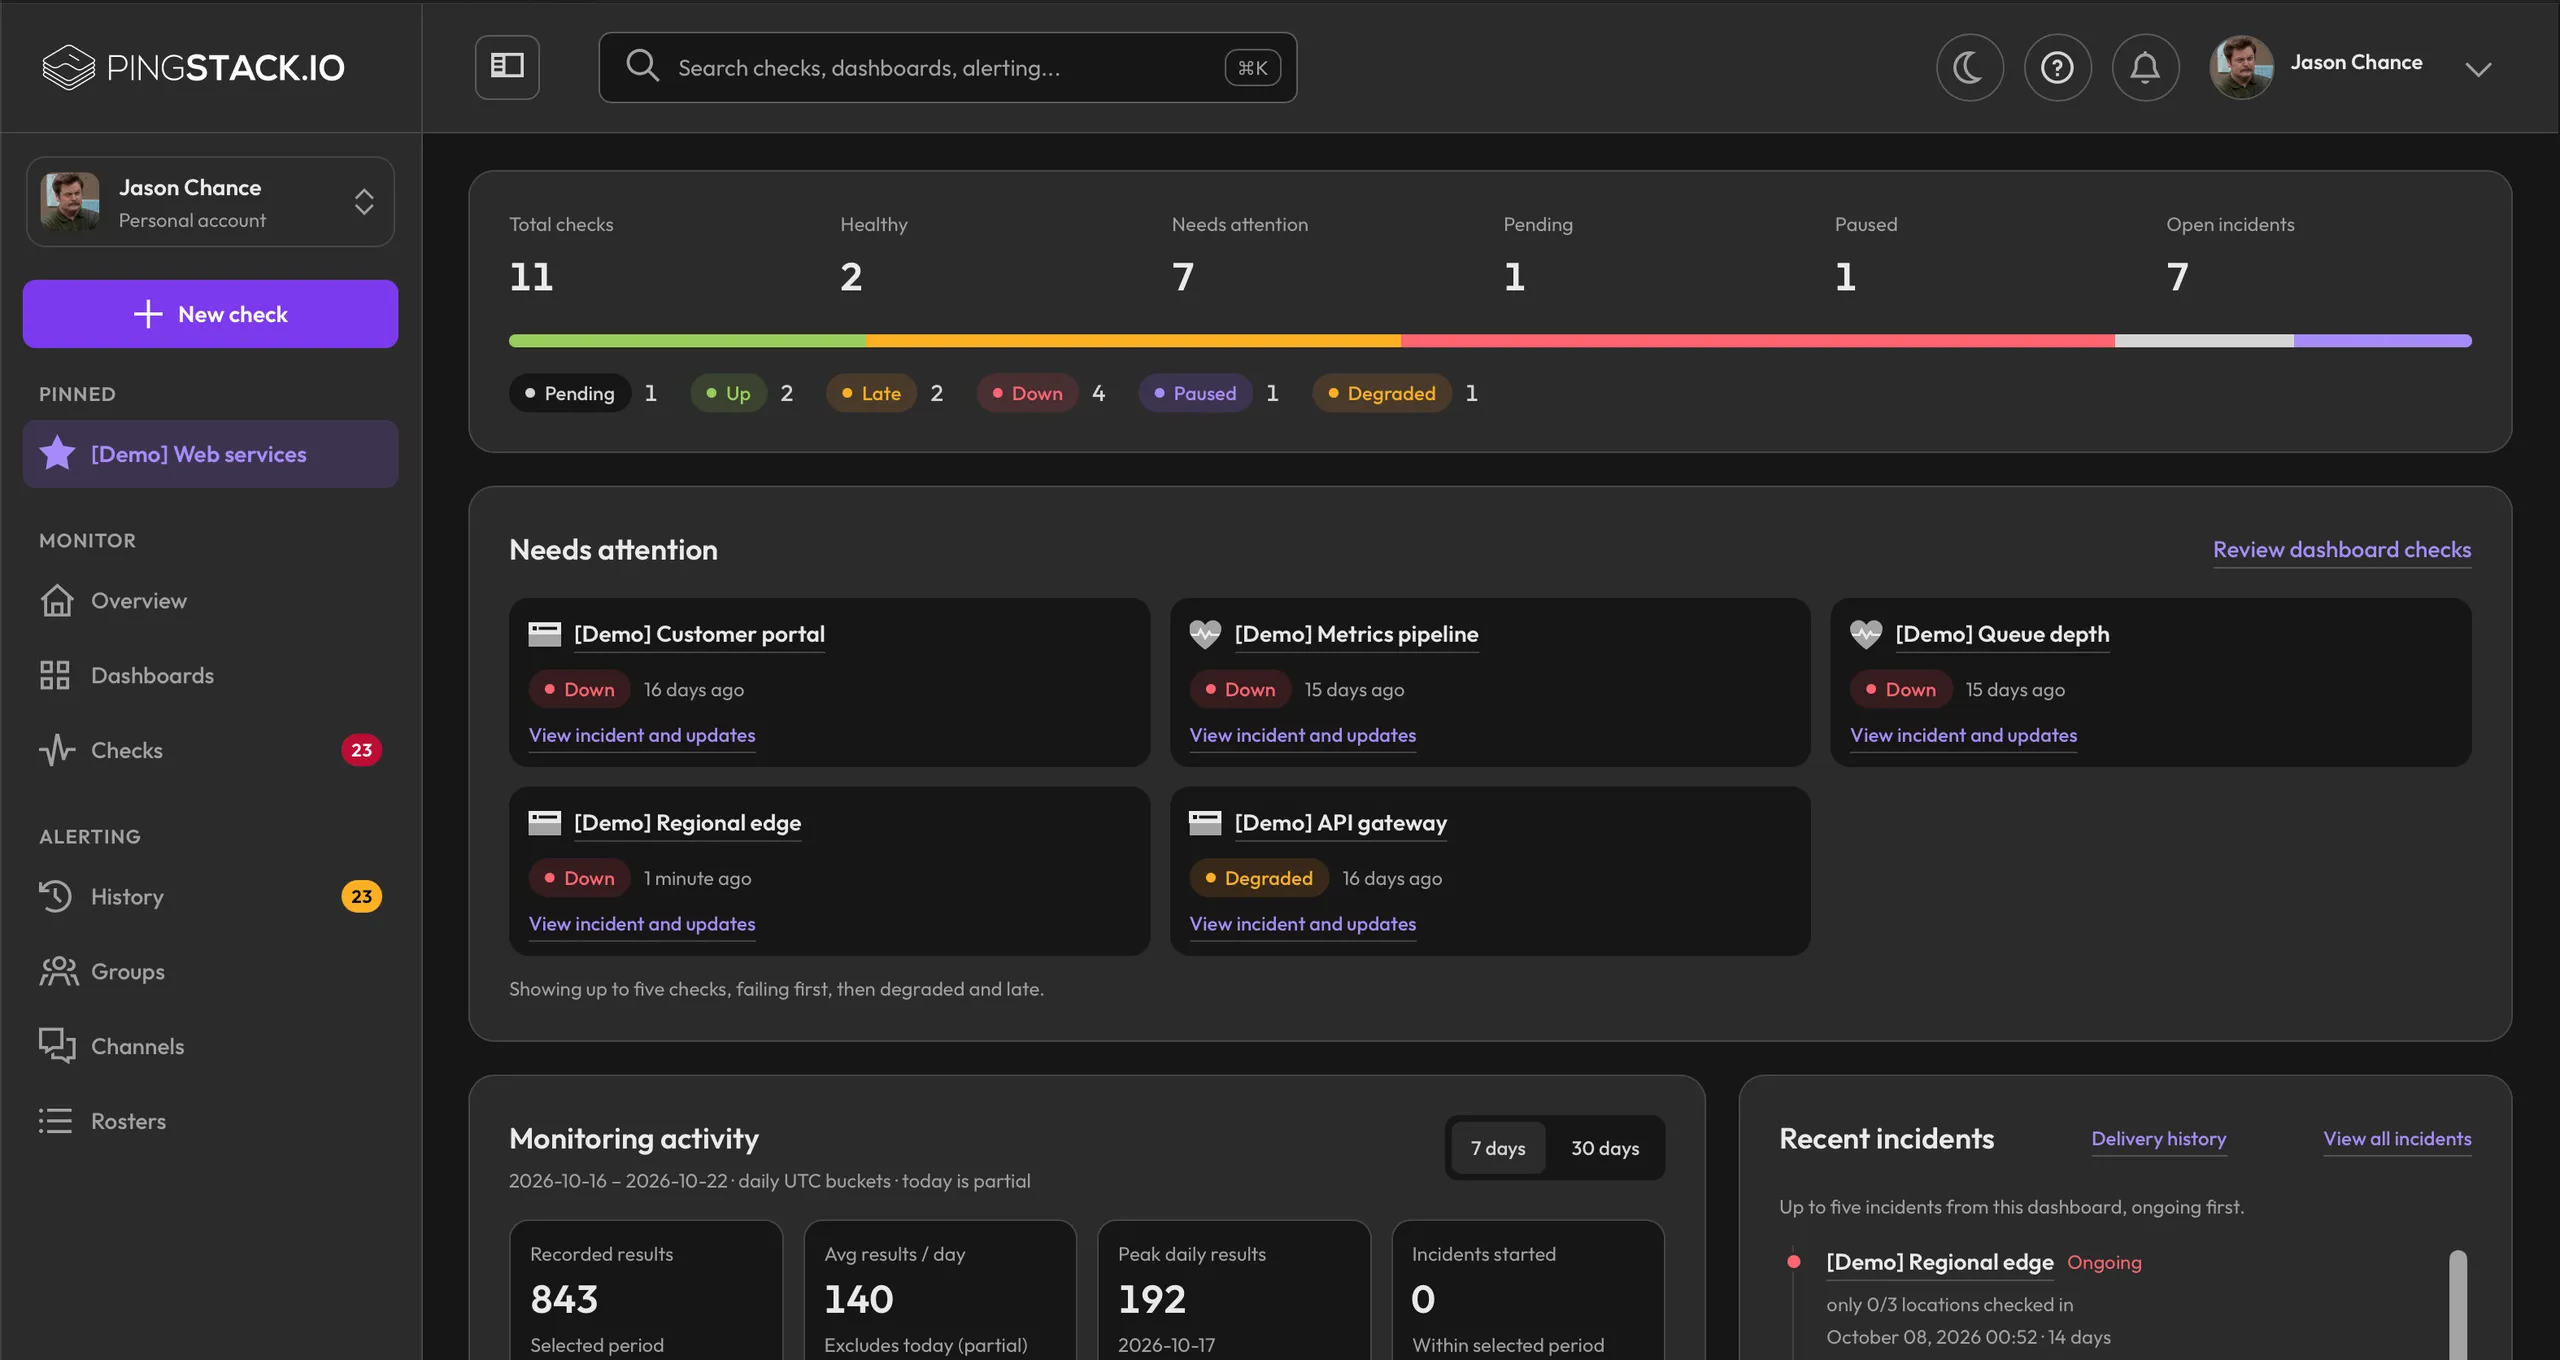
Every check shows its uptime for the last 7 and 30 days, its incident history, and its p50 and p95 latency.
Comparing tools? See the UptimeRobot alternative.
Common questions
How many regions check my site?
One on Free, and all of them on paid plans: US East, EU West and AP South today.
Will one slow region page me?
You decide. Set how many regions must fail before the check is degraded and before it's failing, so one bad network path doesn't wake anyone.
Can I monitor an internal site?
No. Website checks run from Pingstack's probe regions and can only reach public addresses. For internal services, send a heartbeat from inside your network.
Does a website check count the same as any other check?
Yes. One URL is one check, whatever its interval.
